National Land Cover Dataset
Data Availability
These data are complete for the continental US and can be accessed throught the MRLC website.
Approach
The cooperators of SEGAP are contributing to the derivation of a second generation National Land Cover Database (NLCD 2001). SEGAP is mapping 30 meter resolution landcover for seven mapping zones. For the NLCD 2001 project, a Classification and Regression Tree (CART) method will be used. This method provides an efficient robust way to classify large sets of imagery quickly. We are using See5, the recommended proprietary software for NLCD 2001 land cover generation.
The CART method is very reference point intensive; thousands of reference points per zone are needed to generate an acceptable decision tree. At a minimum, there should be 250 reference points per common class and 50 per rare class, all of which are well distributed across the mapping zone. Rather than target a static minimum number of points per class, we try to capture the spectral variability of the mapping zone input layers within our reference point set. While we may use a standard target for number of total points (e.g., (250 x 12) + (50 x 3) = 3150), those points will be sampled proportionally across the spectral variability of the data. In addition to being numerous, the reference data need to be temporally synchronized with the input imagery.
Classification Scheme
The National Landcover Dataset is being classified according to the NLCD 2001 Land Cover Class Definitions.
Ancillary Data Development
Anclillary data is used in the landcover mapping process to provide non-spectral information to aid in the classification procedure.
Agricultural StatisticsPercentages of total agricultural land area comprised of row crops vs. pasture/hay crops were determined for each county in the Southeastern US. We obtained agricultural product information for each county from the National Agricultural Statistics Service (NASS) 1997 Census of Agriculture database (http://www.nass.usda.gov/Census_of_Agriculture). We designed custom queries for each state to report the following variables by county:
- total row crops (
TRC) - total pasture/hay (
TPH) - total land used for crops (
TC) - cropland used only for pasture and grazing (
CPG) - pasture and rangeland other than cropland and wooded pastureland (
PR) - hay (
H)
Total row crop was calculated as: TRC = TC - (CPG - H).
Total pasture/hay was calculated as: TPH = CPG + (H + PR).
Percentages of pasture/hay and cropland are calculated by dividing the totals by the total agricultural area.
%TRC = TRC / (TC + PR)
%TPH = TPH / (TC + PR)
This data is saved as a table which can be linked to a GIS layer of southeastern counties for use in land cover classification or for display in a GIS.
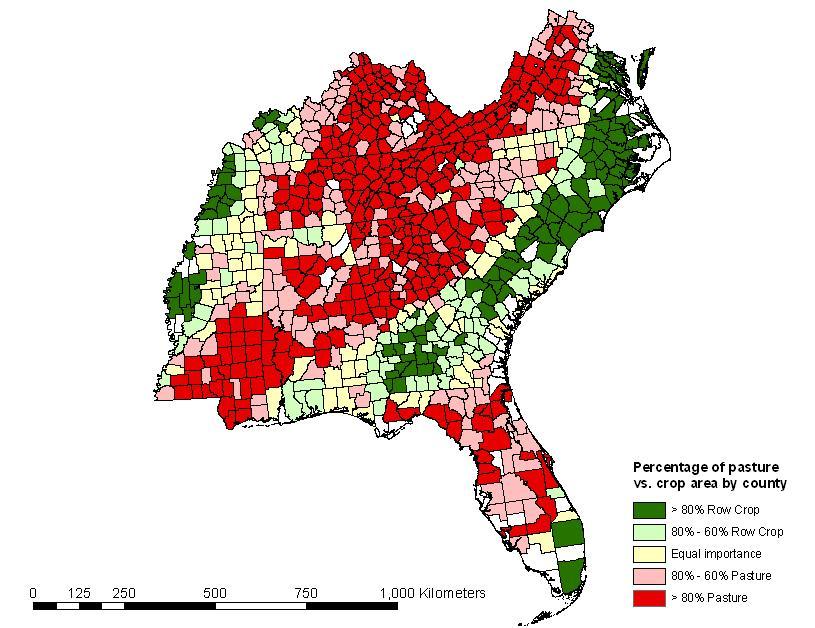 |
Figure: Southeastern U.S. relative percentages of row crop vs. pasture by county. Click on the map for a larger image. |
National Wetlands Inventory (NWI)
A regional raster mosaic of National Wetland Inventory (NWI) dataset is being created using existing vector and hardcopy NWI coverages. A crosswalk table is being used to assign numeric Gap codes to alphanumeric NWI data. For areas where NWI coverages exist in digital format, the following procedure is used:
- NWI quadrangle coverages are downloaded in interchange format from the US Fish and Wildlife Service grouped by 1:250,000 quadrangle.
- Quads are imported to coverage polygon format and reprojected to match existing GAP data.
- Attributes are extracted from each quad and compared to the crosswalk table. Any undefined attributes are assigned matching GAP codes added to the crosswalk table.
- Each individual NWI quad coverage is converted to a grid, using the crosswalk table to assign cell values.
- Quads are then mosaiced into 1:250k units. Mosaics can be clipped from 1:250k quads according to mapping zone boundaries.