Canopy Cover Mapping
Data Availability
These data are complete for the continental US and can be accessed throught the MRLC website.
Approach
The Natural Resources Spatial Analysis Laboratory (NARSAL) at the Institute of Ecology at the University of Georgia undertook mapping percent canopy closure for the southeastern United States as part of the Southeast Gap Analysis Project.
Mapping zones divide the region by physiographic properties. This decreases heterogeneity in canopy signatures improving mapping results. Mosaicked ETM+ satellite imagery was provided by Eros Data Center on a zone-by-zone basis.
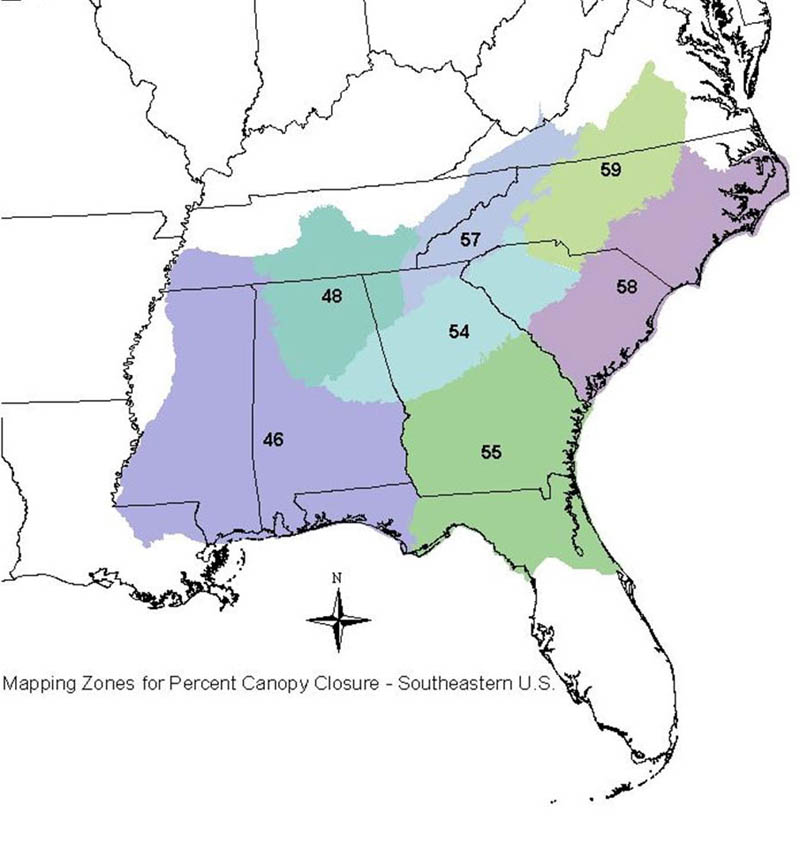 |
Percent Canopy Closure Mapping Zones for Southeast Gap. To see a larger map, click the image above. |
Using CART methodologies, as outlined by the Eros Data Center (EDC) (Limin Yang et al, 2002) , we classified DOQQ's to create 1m resolution, highly accurate, binary canopy/non-canopy images. The classified images were run through a model that calculates percent canopy by pixel. The data was resampled to 30m and mosaicked across a single zone.
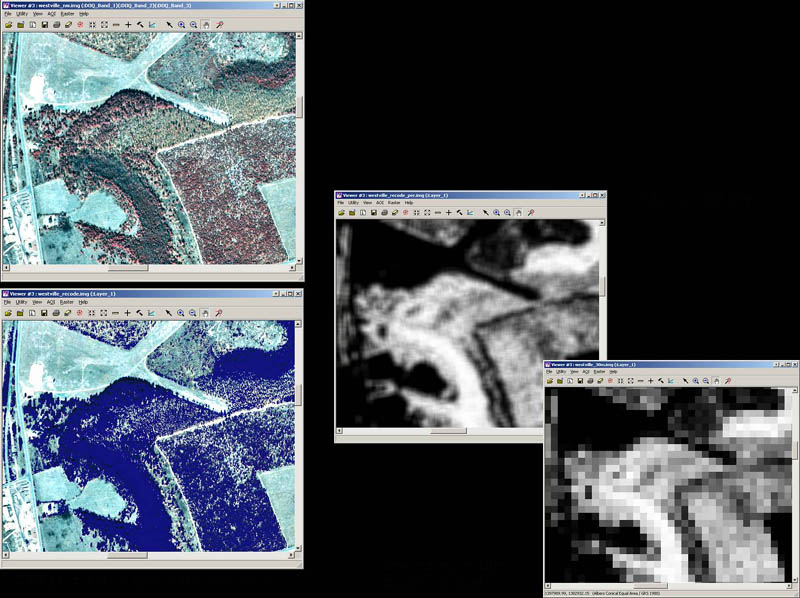 |
DOQQ classification process. Click above to view larger image. |
High-resolution aerial photography is available for many areas to assist in interpreting the DOQQ's.
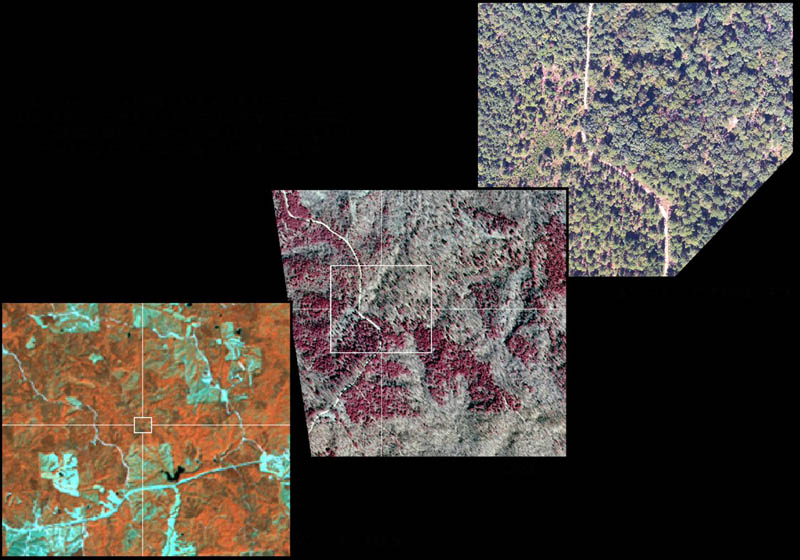 |
High resolution videography is referenced for a more accurate interpretation of tree canopy from DOQQ’s. The DOQQ classifications serve as the training data for modeling percent canopy from TM imagery. |
The classified DOQQ's are used as training data to build a regression-tree model using up to 3 seasons of EMT+ imagery and ancillary data in Cubist software.
The model was applied to create a map of percent canopy closure for that zone. Masking with several ancillary datasets corrects overestimation in non-canopy areas such as agricultural fields and clear-cut forests.
 |
Finished map products are thematic canopy classifications displayed with a legend spreading from white (zero percent canopy) to deep green (100% canopy closure). In an effort to simplify the legend, the sample provided shows the gradation of green for every 20th percent. |
Yang, L., Huang, C., Homer, C., Wylie, B., and Coan, M. 2003. An approach for mapping large-area impervious surfaces: Synergistic use of Landsat 7 ETM+ and high spatial resolution imagery. Canadian Journal of Remote Sensing, Vol. 29, No. 2, pp. 230-240.